What is a solar panel output calculator?
A solar panel output calculator estimates how much electrical power a photovoltaic system may produce from a given location, system size, panel direction and tilt. This TechBoard calculator also accounts for user-defined shading and system losses, so you can compare different installation setups before getting a site-specific design.
The calculator can work in two modes. Its built-in mode estimates the sun position and clear-sky solar input directly in your browser. When you load live solar data, it uses hourly solar-radiation and temperature information from Open-Meteo to make today’s profile more weather-aware.
How to use the solar calculator
Enter the latitude and longitude manually or use the location button. Set the installed system size in kilowatts, panel direction, tilt, shading and expected system losses. If you are unsure about orientation, the recommendation button applies a simple latitude-based starting point that you can adjust afterward.
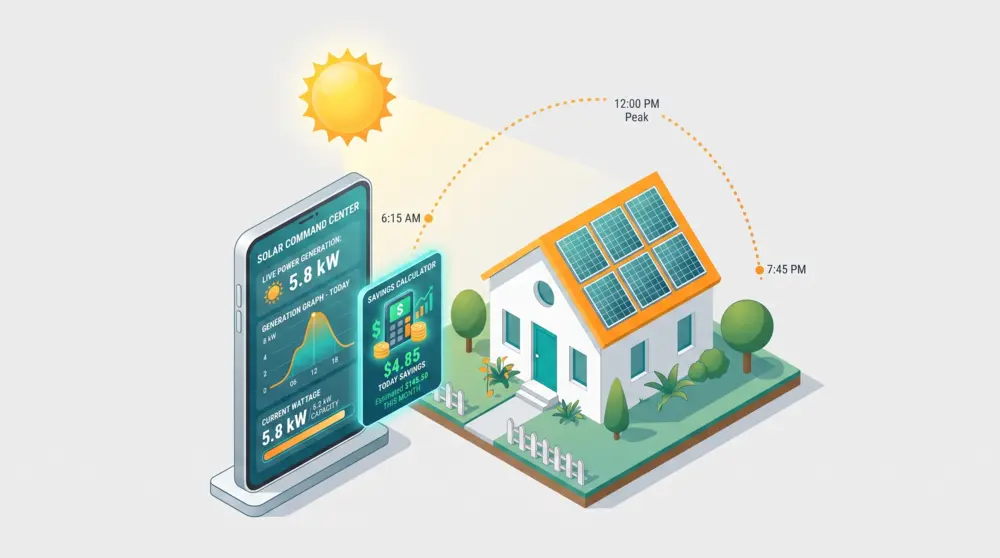
Use the time slider to see how output changes during the day. The results show estimated current solar power, today’s energy, a 30-day equivalent, electricity value and current grid flow. The generation chart makes it easier to compare morning, midday and evening performance.
Battery and household load estimates
Enable the battery section to enter battery capacity, starting charge, maximum charge/discharge power and round-trip efficiency. The calculator simulates the battery in 15-minute steps against the base household load and estimated solar generation. It then shows battery charge, estimated end-of-day state of charge, grid import and grid export.
Battery results are planning estimates rather than a full storage-system design. Real batteries may have reserve limits, inverter restrictions, battery-management rules, variable efficiency and manufacturer-specific operating limits that are not represented here.
Improving a solar estimate
Use realistic values for shading and system losses. Trees, nearby structures, dust, module temperature, inverter clipping, wiring losses and roof geometry can materially change actual production. If live radiation is available for your location, load it before comparing today’s expected output.
The 30-day figures repeat the calculated conditions for the current day. They are useful as a quick comparison, but they are not a seasonal or annual production forecast. For investment or engineering decisions, compare the result with a professional site survey and a bankable PV simulation.